

Revolutionizing NBA Team Composition with Modern Portfolio Theory
Revolutionizing NBA Team Composition with Modern Portfolio Theory

Modern Portfolio Theory (MPT) is a financial concept that helps investors maximize returns while minimizing risk through diversified portfolios. Introduced by Harry Markowitz in 1952, the core idea is that an optimal blend of assets can reduce the overall volatility of the portfolio, thereby enhancing the probability of achieving stable returns.
In the context of the NBA, we can think of each player as an 'asset' whose performance has both 'returns' and 'risks'. Here, the 'return' is the player’s ability to contribute to wins, quantified by a metric known as Win Shares. This statistic measures the total victories a player produces for their team through their on-court actions. The 'risk' is defined by the variability (standard deviation) of these Win Shares over multiple seasons, representing how consistent a player is.
Just as in the investment world, where the balance of assets is tailored not only to maximize returns but also to align with the investor’s risk tolerance, our application of MPT to NBA team composition includes crucial practical constraints to ensure feasibility such as the salary cap and position requirements.
Understanding Win Shares: The ‘Return’
Win Shares (WS) is a comprehensive statistic designed to quantify the total contribution of a player to their team’s success within a single number. Developed to bridge the gap between individual performance and team victory, WS attributes a player's involvement in team wins, integrating both offensive and defensive metrics. This formula is based on principles outlined in Dean Oliver’s book, “Basketball on Paper”, and was officially created by John Zubatko. The idea and name was based on the win share statistic established in baseball’s sabermetrics community.
Traditionally, the calculation of WS involves several key steps, central to which is the estimation of 'points produced' by a player. This metric is critical as it quantifies a player's offensive contribution in terms of points, which is directly linked to winning games. However, this conventional method uses basic scoring and assisting figures, potentially overlooking the nuances of modern basketball playmaking and efficiency.
Introducing Offensive Efficiency in Win Shares Calculation
In an attempt to refine the estimation of a player's offensive value, we have integrated the concept of Offensive Efficiency (OE) into the WS formula. OE enhances the traditional 'points produced' by considering the efficiency with which these points are produced. For more details, we covered OE in a previous article.
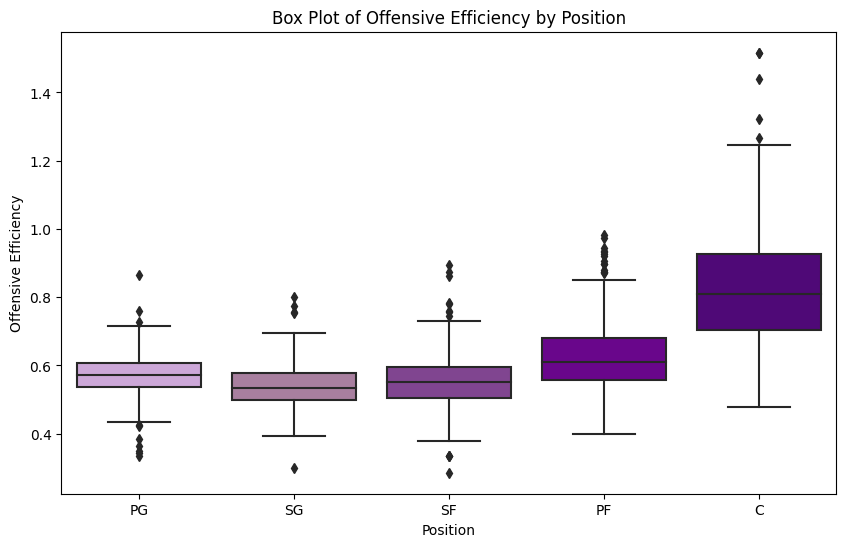
If we take a look at the above boxplots, average OEs logically suggest a pattern where positions traditionally closer to the basket (C and PF) tend to have higher OE, due to higher FG%, more offensive rebounds, and being less prone to turn the ball over.
It's become clear that a one-size-fits-all approach does not accurately reflect the varied contributions of each role. To address this, we propose an adjustment to the points produced by players, factoring in their offensive efficiency relative to the average OE for their respective positions. Specifically, we will enhance the points produced for each player by multiplying them by the below factor:
This adjustment not only accounts for the positional differences but also rewards players who exhibit higher efficiency than the norm for their position.
Win Shares
To calculate WS, we used our efficient points produced (EFF PP) and subtracted the product of 0.92, league points per possession, and a player's offensive possessions. Then, we divided this marginal offense by marginal points per win, which factors in team and league pace. We used defensive WS directly provided by the NBA, and both components are summed to derive total WS for each player.
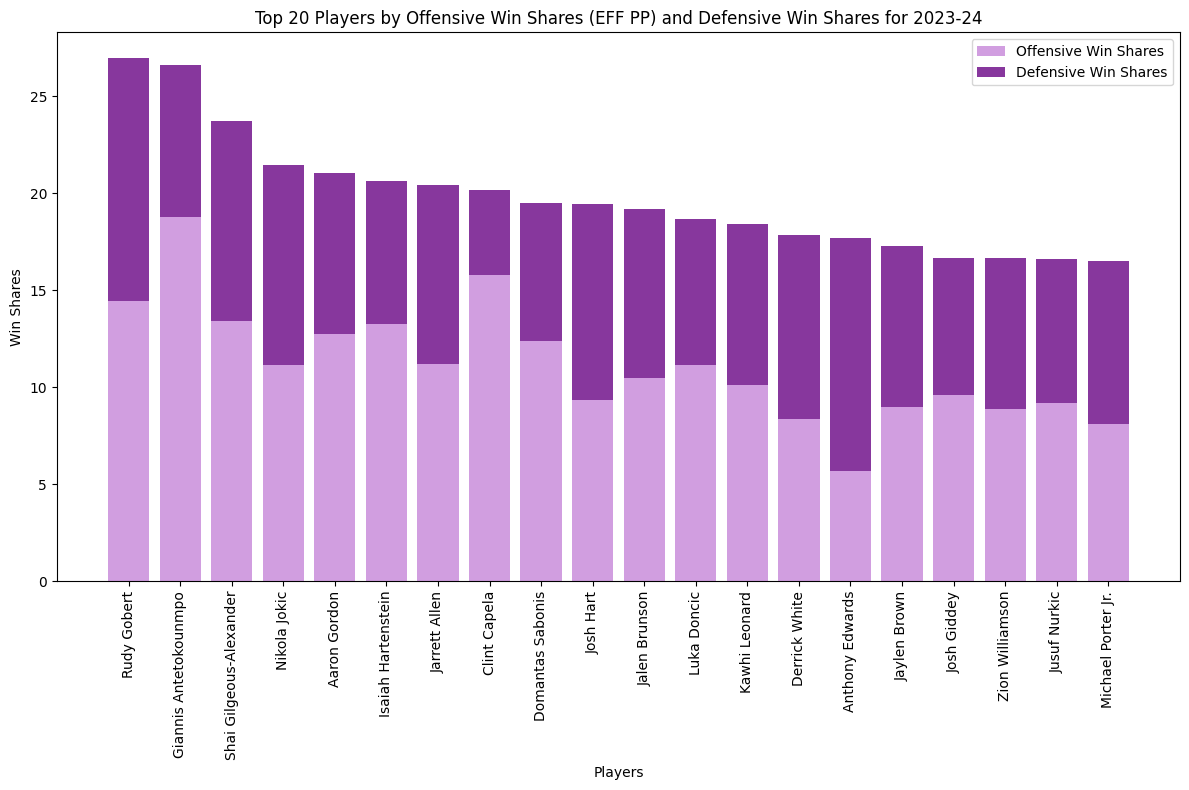
While surprising at first glance, the presence of role players like Josh Hart, Derrick White, Josh Giddey, or Michael Porter Jr. among the top 20 in WS highlights their significant impact and underscores why their teams are among top contenders for the championship, finishing the regular season in the top three of their respective conferences.
To ensure a fair comparison among players, particularly in contexts where injuries or rest days lead to differing numbers of games played across the season, we converted WS on a per-game basis.
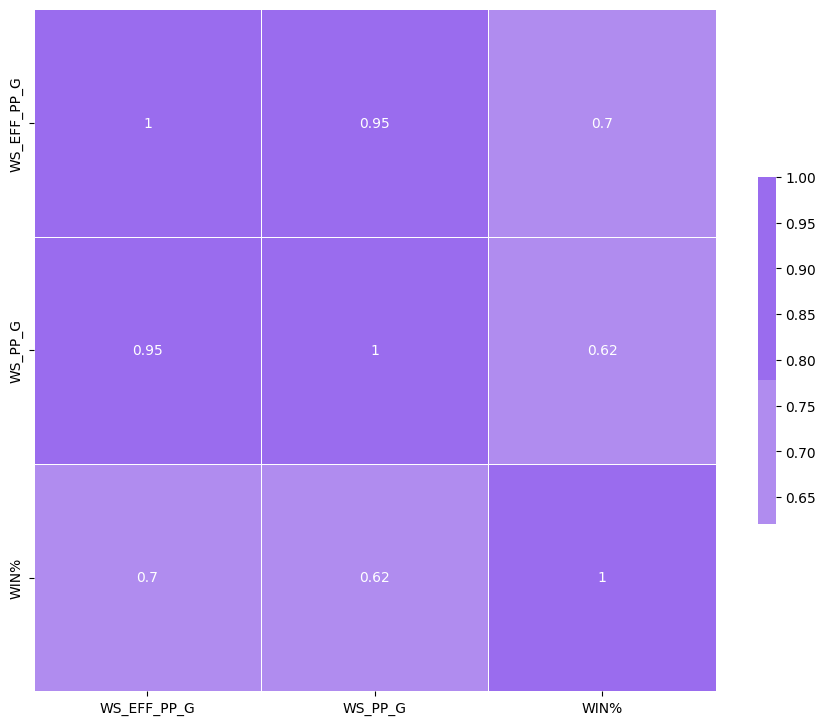
Upon recalculating WS (per game) using EFF PP instead of traditional points produced, an improvement in the correlation with team success was observed. As we can see in the correlation matrix above, while the classic WS method showed a correlation of 0.62 with team wins, this correlation increases to 0.7 when using EFF PP. This indicates a stronger alignment with actual team outcomes and underscores the importance of efficiency in points production.
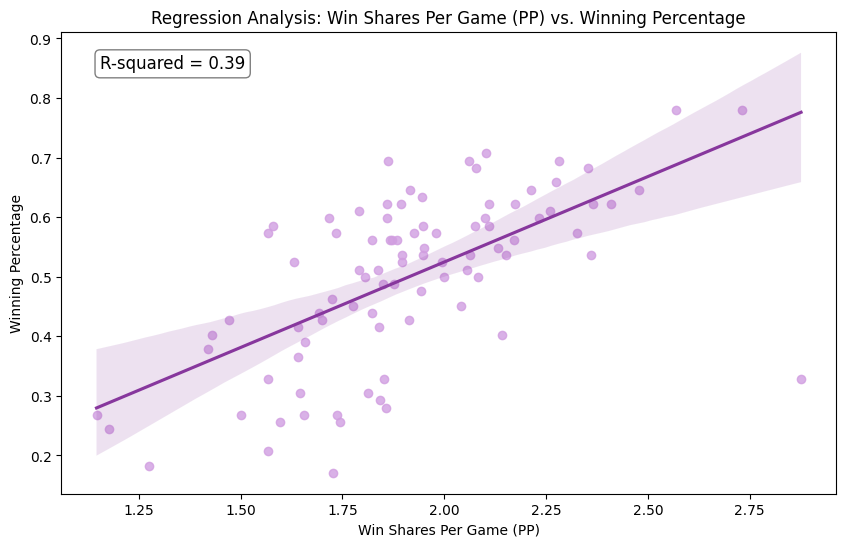
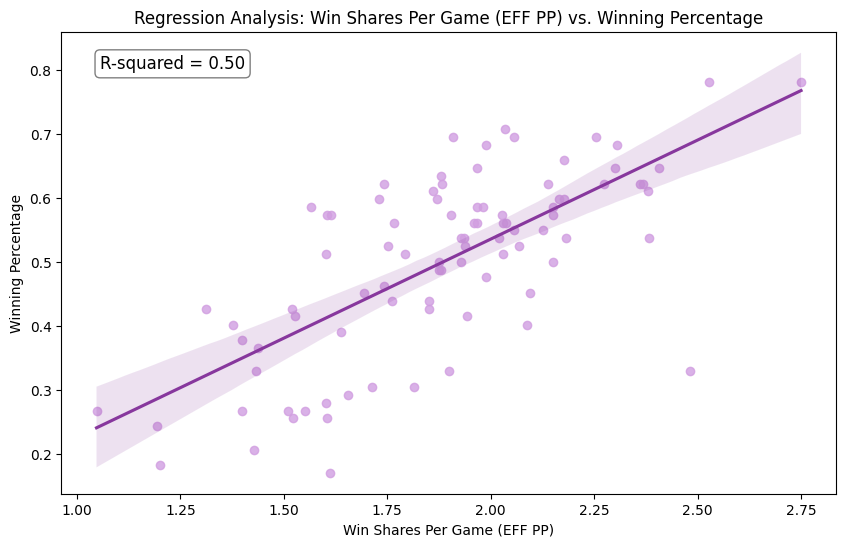
Furthermore, a regression analysis comparing the total WS per team per season (using both methods) with a team win percentage revealed that the R-squared value increased from 0.39 to 0.50 when using EFF PP. This substantial increase validates the enhanced predictive power of our modified WS.
Risk-Return
In this next part of our analysis, we wanted to look at the relationship between risk and returns for NBA players. Imagine players as investments, where a higher return usually comes with higher risk. Ideally, you want high returns with as little risk as possible.
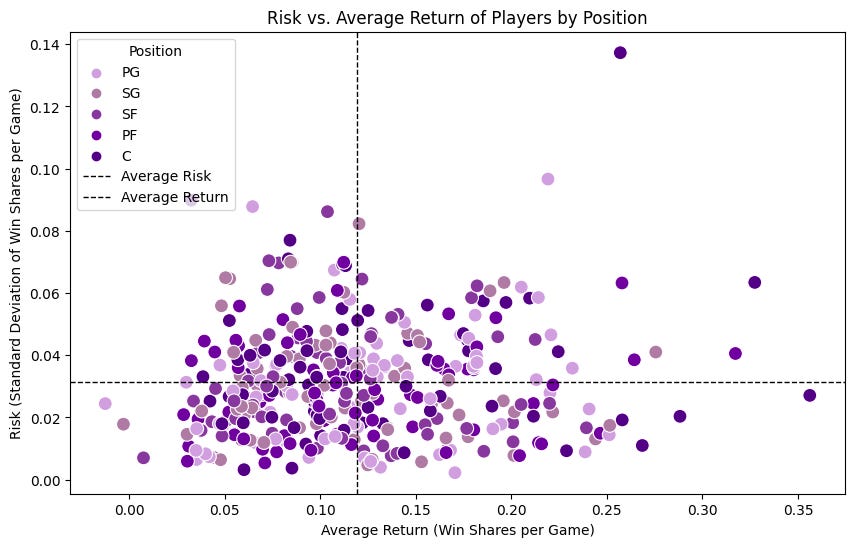
To assess 'risk,' we looked at the variability in performance, calculated as the standard deviation of a player's win shares. A three-year span is utilized for these calculations to smooth the impact of one season's peaks or troughs and provide a more reliable assessment of a player's stable performance.
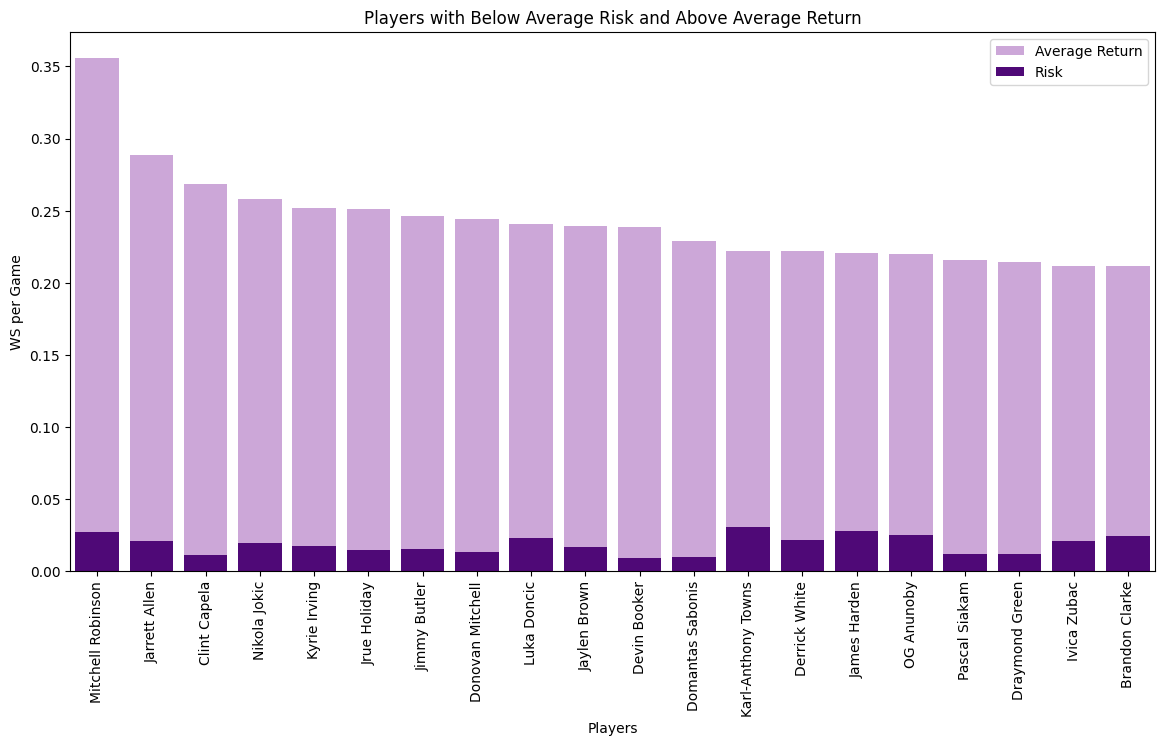
In the context of applying MPT to NBA roster building, players with above-average returns and below-average risk are highly valuable. They contribute consistently to wins while maintaining stable performance, similar to "blue-chip" stocks in finance. Below is a list of 20 players with below average risk and above average return, sorted by the last three seasons’ average modified WS per game.
Similar to how higher-returning financial assets tend to be more expensive, especially if they also exhibit low volatility, players who provide higher returns in terms of win shares generally command higher salaries.
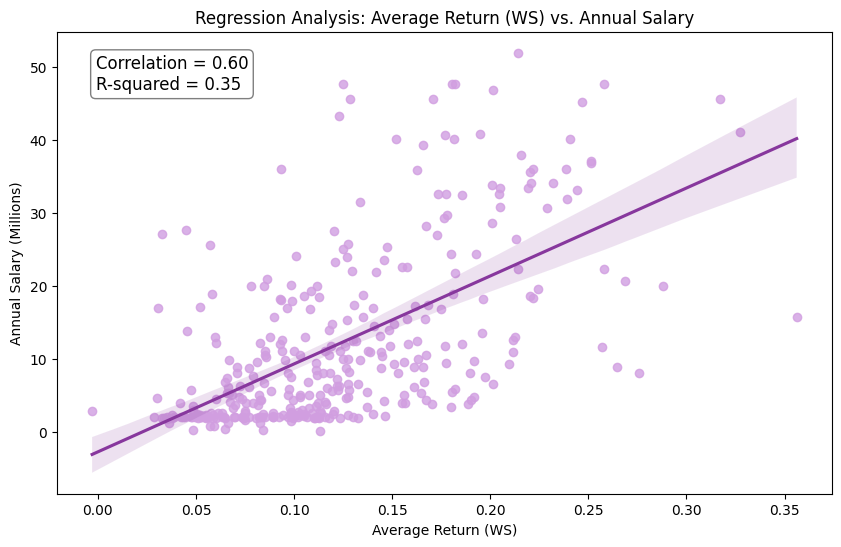
This correlation underscores the economic principle that high performance comes at a premium. However, consistency in performance doesn't necessarily lead to a proportional increase in salary. When performing a linear regression, we found that adding risk as a factor alongside return didn't significantly improve the model's predictive power. Risk's impact on salary wasn't statistically significant, and the R-squared value remained unchanged.
Moving into constructing our player portfolio, the insights from our risk-return analysis are crucial. They reveal opportunities to assemble a team that mirrors the principles of MPT (maximizing performance while managing risk). By identifying high ‘return’ players whose salaries don't fully reflect their ‘risk’, we can build a competitive, cost-effective team.
Building The Team
To create optimal NBA team portfolios, we used Mixed-Integer Linear Programming (MILP), treating each player as a binary decision (selected or not). The optimizer operates by examining all possible combinations of players that respect our constraints, which include staying under a $141 million salary cap, selecting exactly 15 players, and not exceeding three players per position, to ensure a realistic and balanced team composition. The optimizer then calculates the ‘total return’ or the ‘total risk’ for each combination, seeking the one that best achieves our specified objective.
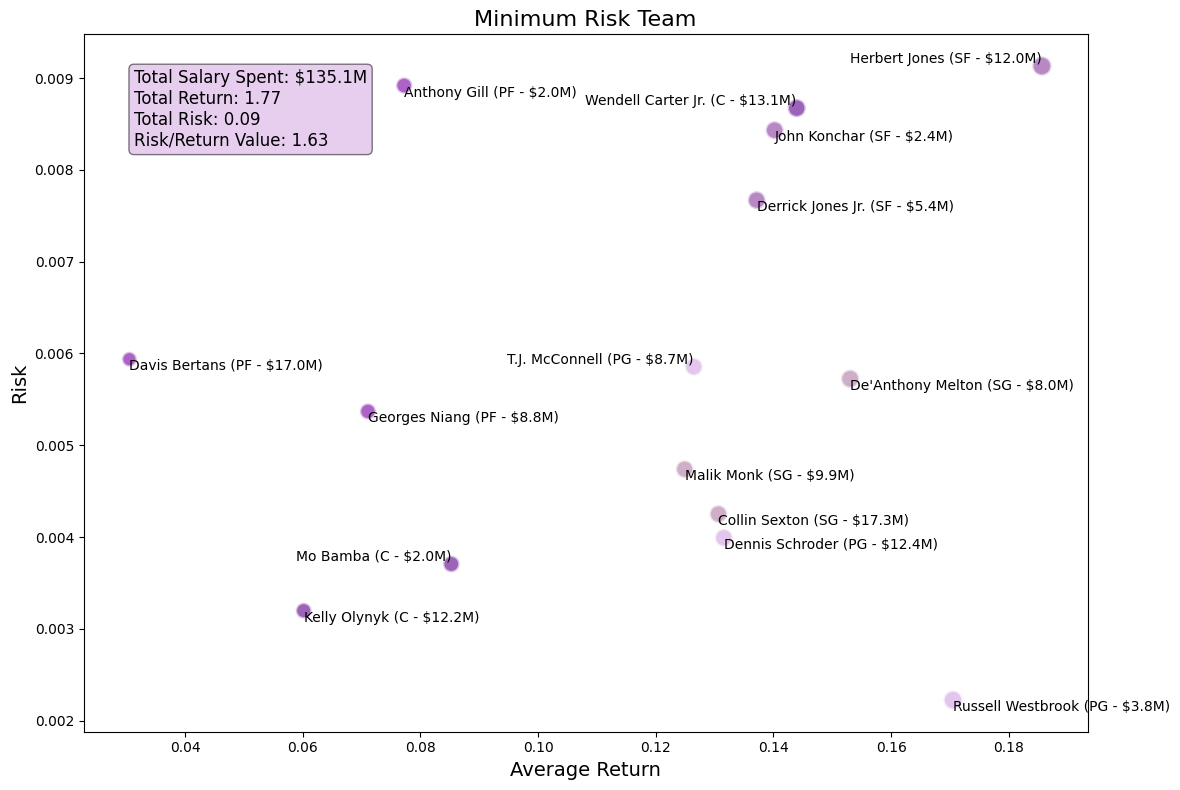
We began by exploring two extreme strategies: maximizing ‘total return’ and minimizing ‘total risk’.
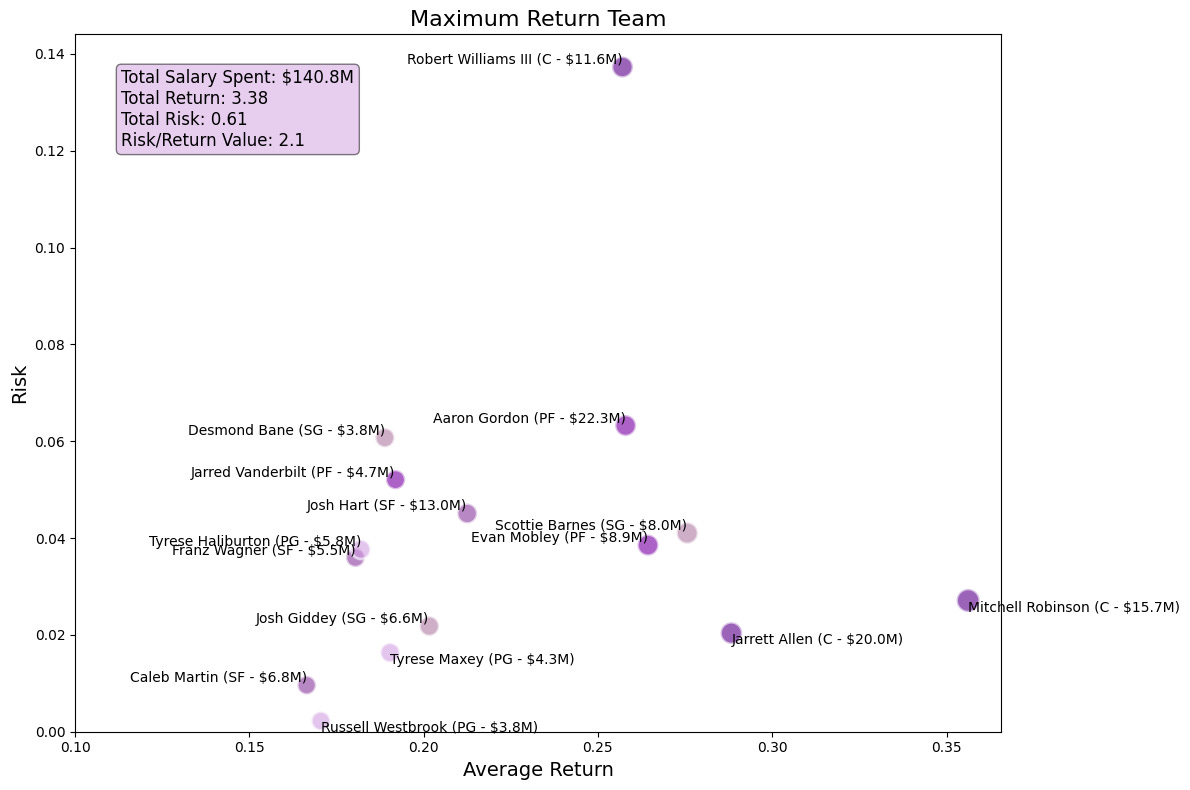
The above roster targeted the highest possible return, focusing on assembling a team capable of achieving the maximum modified WS per game but with an elevated risk. Conversely, the below strategy prioritized minimizing the risk associated with player performance fluctuations, aiming for a stable yet less aggressive team performance.
The risk/return value for each team, being calculated as follows:
helps us evaluate the balance between the potential rewards and the risks associated with each portfolio. A higher value indicates a more favorable balance, where the returns sufficiently compensate for the risks.
In financial theory, the efficient frontier represents the set of portfolios that provide the highest expected return for a given level of risk, or the lowest risk for a given level of return. Applying this concept to NBA team building, we explored 10 potential team compositions, each designed to be within a defined range of expected returns, from the average total return of teams that have made the playoffs over the last three seasons (benchmark for competitive success) to the maximum return team we've just analyzed.
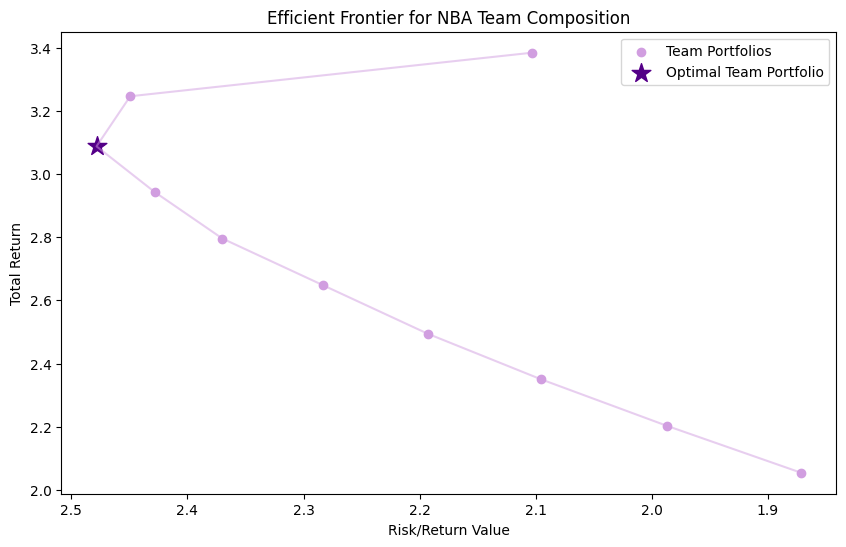
By treating each team as a portfolio of players, we optimized each lineup to achieve the best mix of total return and risk, similar to maximizing the Sharpe ratio in investment portfolios. This method allowed us to pinpoint the team with the highest risk/return value, effectively identifying the optimal team.
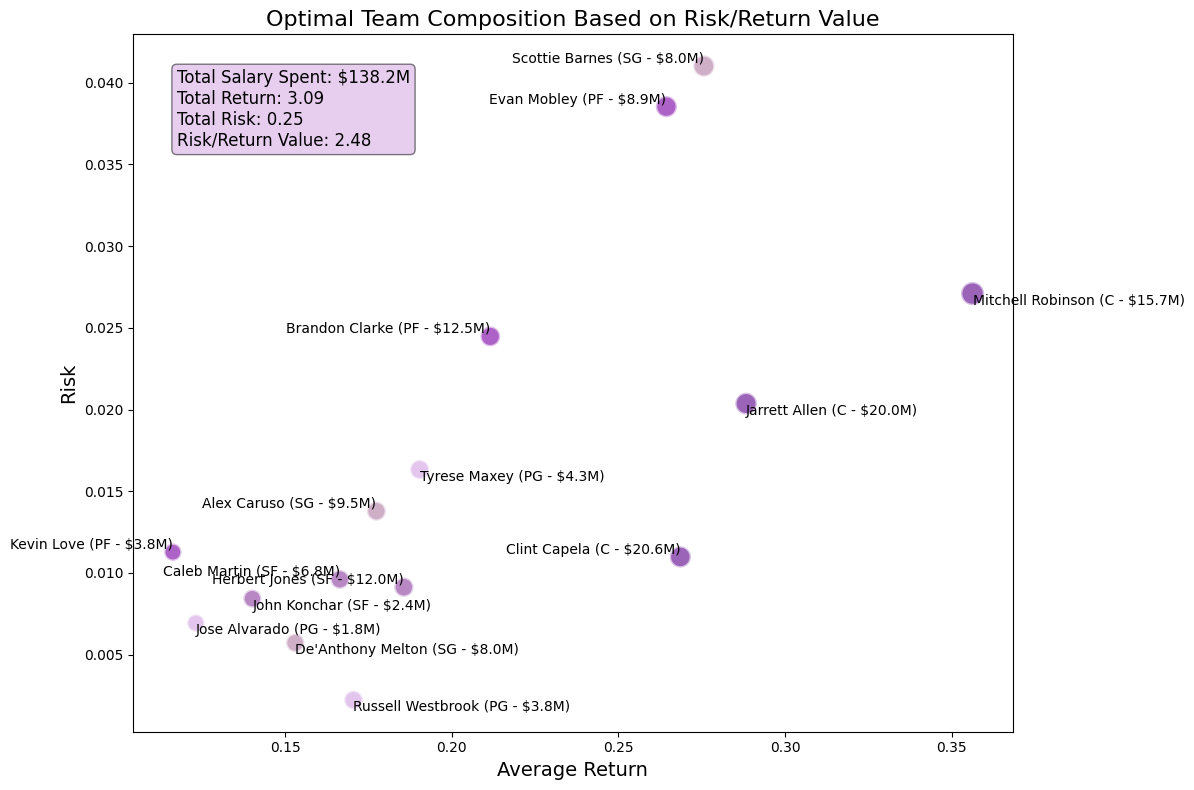
The above showcases the optimal NBA team derived from our MPT model. This lineup features a well-balanced mix of players across all positions:
Centers: Mitchell Robinson, Jarrett Allen, and Clint Capela. These players bring significant rebounding and shot-blocking capabilities, contributing heavily to the defensive backbone of their respective teams. They exhibit high efficiency around the basket, which is evident from their high average returns.
Forwards: The team includes versatile forwards like Scottie Barnes (averaging 21.72 efficient points produced over his first 3 seasons in the NBA) and Brandon Clarke (top 10 defensive rating this season amongst players with more than 15 minutes per game), who contribute effectively on both ends of the court. At just 22 years old, Mobley brings a unique blend of size, skill, and agility that allows him to be effective on both ends of the court as well. Kevin Love adds depth, provide veteran experience, and three-point shooting.
Guards: The backcourt is composed of players like Tyrese Maxey, who is one of the most entertaining players to watch this season, perfectly filling Embiid’s role of offensive leader at Philly this year, averaging 22.70 efficient points produced and shooting 41.13% beyond the arc over the last 3 seasons. Russell Westbrook brings veteran leadership and dynamic playmaking, while Alex Caruso and Jose Alvarado add defensive ability.

The model crafted a team that not only respects the salary cap and maintains a balanced mix of positions but also showcases a lot of synergy among the players. It goes beyond assembling consistent scorers or great defenders and provides a perfect blend of both qualities across all positions with a team built with a few stars but important role players as well.
Limitations
Analyzing past performance to build an NBA team faces similar limitations as those encountered in financial markets, where past returns are not always indicative of future ones. This approach can undervalue young players whose current statistics may not fully reflect their potential, as they have not yet reached their peak performance years yet. Conversely, it might overvalue veterans like Russell Westbrook, whose future performance may decline as they approach the end of their careers or consider retirement.
Furthermore, the model's reliance on the last three years of data excludes rookies or sophomores who might be central to a team's future success (i.e. players like Victor Wembanyama, who, despite their immense potential, have limited NBA track records). Additionally, the rookie contract structure of the NBA introduces another layer of complexity. Players such as Tyrese Maxey, who is nearing the end of his rookie contract (only $4.34 million this season), will surely be a maximum contract player this summer, significantly impacting the team's salary cap dynamics. The same goes for other youngsters like Scottie Barnes and Evan Mobley, whose current contract values do not accurately reflect their market value and impact on the court.
Future Directions
To improve the model, future directions could include adjusting for player age and potential growth, incorporating more sophisticated metrics for player valuation, and dynamically modeling salary cap implications over multiple seasons. This would allow for a more nuanced understanding of player development or decline, and contract cycles, ultimately leading to more strategic and forward-looking team compositions.
In summary, we applied Modern Portfolio Theory (MPT) to NBA team management by assessing players as assets with quantifiable returns and risks, using a modified version of Win Shares to measure contributions to team wins. By optimizing team compositions while respecting the NBA salary cap and roster requirements, exploring strategies to maximize returns and minimize risks. We employed financial concepts like the efficient frontier to identify the optimal team composition, achieving a balance between player performance, risk, and salary efficiency. This approach demonstrates the practical application of MPT in sports management, offering a strategic framework for building balanced and competitive NBA teams. This methodology is particularly useful for crafting strategies during expansion team creation or evaluating potential trades to see how replacing one player with another affects the team's risk/reward profile.
Source: NBA, Basketball Reference, Spotrac
Disclaimer: The essence of data analysis is not to capture the entirety of the story but to piece together a narrative from the data fragments at hand. While the data utilized herein is robust and comprehensive, it's not exhaustive. Every statistical representation has its constraints. Our aim is to utilize accessible data judiciously, aiming for an honest and insightful interpretation, recognizing that there are always more layers to the story.
Thanks, very thought provoking.
I need to spend some more time with the article, but my first impression is that the RISK definition isn't right. In the NBA I think that a team's RISK is that players will underperform their expected value. Conversely, REWARD is when a player over-performs his expected value.
The composite of Risk and Reward should correlate with team winning. However instead of a pure per game stat, I think that the players total results need to be factored in. For example, Joel Embiid was 6th in WS/48 min (BB REF) and Tyrese Maxey was 95th. In total WS Maxey was 24th and Embiid was 28th. Availability matters too.A blend of Total and Per Game stats helps screen out performances that aren't likely scaleable. A minimum minutes criteria could also help with screening. RW III played only 6 games and MitchRob played less than 800 minutes total.
Anyway, just my initial thoughts, thanks again for the article.