

Unpacking the NBA Finals: Analyzing Boston's Mastery Over Dallas
Unpacking the NBA Finals: Analyzing Boston's Mastery Over Dallas

The Boston Celtics finally clinched their 18th championship title, surpassing the Lakers to become the franchise with the most titles in NBA history. This remarkable achievement came through their strategic mastery over the Dallas Mavericks, a team led by the incredible duo of Luka Doncic and Kyrie Irving, who formed the highest-scoring guard pair in postseason history.
To truly understand how Boston managed to triumph over such a powerhouse, we turn to a meticulous analysis of play-by-play data. The Mavericks were no ordinary adversary; they eliminated the number one seed Oklahoma City Thunder in six games and dominated one of the main favorites, the Minnesota Timberwolves, conceding only one game in the conference finals.
Each action on the court, from three-point shots to defensive rebounds, tells a story of execution and resilience. By dissecting these plays, we can quantify the impact of key players, highlight successful strategies, and pinpoint the turning points that led to Boston’s victory.
Despite a heavy loss in Game 4 (84-122), the Boston Celtics consistently kept the Dallas Mavericks under the 100-point mark in the other games, securing some tight wins like in Game 2 and Game 3. Overall, Boston scored 508 points while allowing only 496 and this defensive effort was crucial in their victory.
Strategic Shot Selection and Execution: Analyzing Action and Shot Types
Despite Boston's overall victory, the data reveals some surprising trends. Dallas made more shots and missed fewer, implying a higher shooting percentage. Additionally, Dallas secured more rebounds, likely due to Boston's higher number of missed shots.

Before delving into the types of shots taken by each team, we will compare the stats (per game) over the five games with a correlation analysis to win percentage, as performed in a previous article.
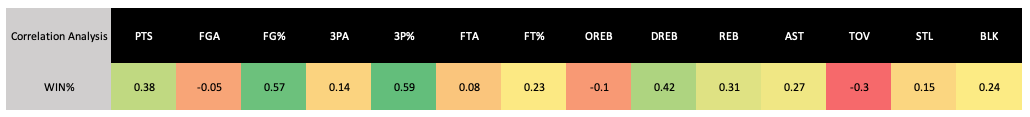
This comparison will help us understand which metrics were most strongly associated with winning in this series.

Boston averaged 101.6 points per game, slightly higher than Dallas's 99.2, with points scored having a significant positive correlation (0.38) with winning percentage. Dallas outperformed Boston in rebounds (43.2 vs. 41.2), with the latter showing a quasi-similar positive correlation (0.31). Boston led in assists (24.2 vs. 16.8), indicating that team play and ball movement were crucial.
Despite Dallas having a higher field goal percentage (45.8% vs. 43.6%) with a strong positive correlation (0.57), Boston outshot Dallas from beyond the arc (33.8% vs. 31.6%) with three-point shooting showing a strong positive correlation (0.59). Both teams averaged 11.4 turnovers per game, with turnovers negatively correlated (-0.3) with winning. Dallas’ significantly lower free throw percentage (68.1% vs. 86%) costed them crucial points (and victories) in tight games. Additionally, Boston led in steals (6.2 vs. 5.8) and blocks (5.4 vs. 2.2), contributing to their defensive efforts.
While Boston led in points and other metrics, Dallas had more rebounds and a better field goal percentage, both strongly correlated with winning, prompting a deeper look into the types of shots taken by each team to uncover further insights.

When analyzing the different types of shots using NBA play-by-play data, we can observe some drastic differences between Boston and Dallas. Boston attempted significantly more jump shots, likely catch-and-shoot shots, which ties back to their higher number of assists, suggesting more ball movement to create open shots. Boston also had more cutting layup shots, emphasizing their off-ball movement and team play. On the other hand, Dallas had a higher number of shots from drives and fadeaways, implying a greater reliance on one-on-one type of offense, isolation basketball, and less ball movement due to Boston's defense and Dallas's intrinsic style of play.
Additionally, Dallas attempted fewer alley-oop dunks than usual, a big part of their pick-and-roll offense, especially after the addition of Daniel Gafford to the squad and increased minutes from rookie Dereck Lively. This reduction suggests that Boston's defensive strategy effectively disrupted one of Dallas's key offensive plays.

As the previous shot type analysis suggested, Boston took more uncontested shots (275) compared to Dallas (255), and consequently fewer contested shots (142 vs. 164). This aligns with Boston's higher number of assists and superior ball movement, which helped create open shots. Despite this strategic advantage, Boston's field goal percentage for uncontested shots was relatively low (37.8%) compared to Dallas (44.3%). However, Boston partially offset this with a better percentage for contested shots (c.7% higher). This discrepancy suggests that, in addition to the type of shot, the location of the shot played a crucial role in why Boston managed to score more points overall despite having a lower field goal percentage.
Precision and Placement: Analyzing Shot Location

The concept of expected value in basketball refers to the average points a team can expect to score from a particular type of shot, based on historical performance data. By analyzing the shot distribution and calculating the expected value, we can assess the efficiency of shot selection.

We discovered that despite taking two fewer shots overall, Boston's shot selection generated an expected value of c.7 points more than Dallas. This equates to 1.345 points per game over the finals (five games) and partially explains why Boston averaged 2.4 more points per game.
The main difference in shot selection between the teams was Boston's greater emphasis on high-value shots, such as corner threes (c.37 more expected points) and above-the-break threes, which have higher points per shot averages (1.10-1.20 and 1.05-1.10 respectively). For reference, Boston was the team in the regular season that attempted the most 3 pointers (47% of FGA). Conversely, Dallas relied more heavily on shots in the paint and while the restricted area is highly effective, it did not yield as high an expected value per shot as Boston's strategy.
From Shot Selection to Player Efficient Offensive Production: Analyzing EOP
Efficient Offensive Production (EOP) quantifies a player's ability to maximize scoring opportunities while minimizing wasted possessions. We covered this metric extensively in part of a previous post. It highlights players who score with high precision and consistency. Comparing a team's overall EOP helps better understand the efficiency of the points produced, providing a deeper insight beyond just points or FG%.

For the Boston Celtics, Jayson Tatum and Jaylen Brown exhibited solid performances with high EOP values of 14.03 and 12.82, respectively. Jrue Holiday and Al Horford also contributed significantly to the team's overall offensive efficiency, reflected by their impressive OE values of 0.71 and 0.72 respectively. Derrick White and Kristaps Porzingis (the latter played only 3 games) also played an important role.
On the other hand, the Dallas Mavericks were logically led by Luka Doncic, who demonstrated outstanding offensive production with an EOP of 16.54, despite a lower OE of 0.49. Kyrie Irving also showed contributed offensively, with an EOP of 11.89. Players like Dereck Lively and Daniel Gafford had high OE values of 1.75 and 1.12, respectively, indicating their efficiency (high FG% shot, many offensive rebounds and few turnovers).

The heatmaps reveal that while both teams had players with high offensive efficiency, the Celtics had a broader distribution of players contributing effectively to their offense. This balanced approach, reflected in the high OE and EOP values across multiple players, underscores why Boston managed to outscore Dallas despite a lower overall field goal percentage. It is further confirmed when looking at the team total EOP. Over the series, Boston produced 7 more efficient points per game than the Mavs.

Defense Wins Championships? Analyzing Hustle Plays
In the adage "defense wins championships," the importance of hustle plays cannot be overstated. To win a championship, players must be willing to "die" on the court, exemplified by Derrick White chipping his teeth while corralling a loose ball in the Celtics' Game 5 victory over the Mavericks. Hustle plays like contested shots, deflections, loose ball recoveries, and box outs disrupt the opposition's offense and secure crucial possessions. Thanks to play-by-play data provided by the NBA, we looked at the key hustle plays during this series.

Celtics head coach Joe Mazzulla emphasized that when you study all NBA Finals games, the team that plays the hardest, is the toughest, most physical, and executes at the highest level consistently, while withstanding mistakes, comes out on top. It seems the Celtics players received this message loud and clear, as they showcased superior hustle plays. Leading in deflections (67 to 58), loose balls recovered (26 to 21), and box outs (49 to 39) compared to the Mavericks, the Celtics' relentless defensive efforts were pivotal in their success.

In the NBA Finals, Jaylen Brown stood out, leading his team in deflections and loose ball recoveries. His all-round performance, paired with a high Efficient Offensive Production (EOP), earned him the Finals MVP title. Brown's efforts were bolstered by key contributions from Jrue Holiday, Derrick White, and Al Horford, who made significant defensive plays and impacted both ends of the floor.
For the Dallas Mavericks, Kyrie Irving posted notable defensive stats, while Luka Doncic, often criticized for his defense, led his team in deflections. Despite these individual efforts, the Mavericks fell short, underscoring the importance of consistent and comprehensive defensive play in winning championships.

Jayson Tatum demonstrated his versatility by being a co-leader in box outs for the Boston Celtics, an impressive feat for a forward rather than a center. This relentless effort on the boards complemented his performance, leading his team in points, assists, and rebounds in the Finals.
In summary, the Boston Celtics clinched their 18th championship by strategically outplaying the Dallas Mavericks through superior teamwork, defensive hustle, and efficient shot selection. Higher assists and ball movement created more open shots, resulting in a higher number of uncontested attempts. Boston's emphasis on high-value shots like corner threes generated a higher expected value. Jaylen Brown's all-round performance earned him Finals MVP, complemented by significant contributions from Jayson Tatum, Jrue Holiday, and Al Horford.
Source: NBA.
Disclaimer: The essence of data analysis is not to capture the entirety of the story but to piece together a narrative from the data fragments at hand. While the data utilized herein is robust and comprehensive, it's not exhaustive. Every statistical representation has its constraints. Our aim is to utilize accessible data judiciously, aiming for an honest and insightful interpretation, recognizing that there are always more layers to the story.